Monday, February 1, 2010

Choropleth maps


Choropleth maps are used to show differing proportions among studied digital recordings by different coloring schemes. This map shows voter turnout as it occurred in the 2004 presidential election. The makers used colors to show percentage of voter turnout while small symbols showed at what age was most common to vote in that state.
http://wpcontent.answers.com/wikipedia/commons/thumb/c/ca/2004US_election_map.svg/280px-2004US_election_map.svg.png

Dot distribution maps


Dot distribution maps are helpful in that they can be used to show abundance or size of different populations. Including people, animals, plant or abiotics. This one shows the population of flowering plants as they are distributed about Africa, as you can see most are centralized in southern Africa.
http://www.ville-ge.ch/musinfo/bd/cjb/africa/images/area.gif

Propaganda maps


Propaganda maps are used to show a perspective and get the makers point of view out there usually by using shock or intimidation by skewing the data shown to something that may not be particularly true. The map of Europe was used to show the greed of Germany and scare those who saw it. The areas occupied by Germany are larger than they actually are and the dark colors leave a negative connotation. This qualifies this map under the definition.
https://blogger.googleusercontent.com/img/b/R29vZ2xl/AVvXsEi6Urgxbtv4BKID04X3FDGvVHSdfZsxfWVQ_pNsjqFofIhhaoepNJRdky9o_I7uaD7WRW9V3gjRSLE_zuFcnz9ZY0ktAzy6b7cP12LJv2KO7BQKfvs1ksv9yE2sdJ7SkDetJAd_PxUkVZG9/s400/Propaganda+map.jpg

Hypsometric maps


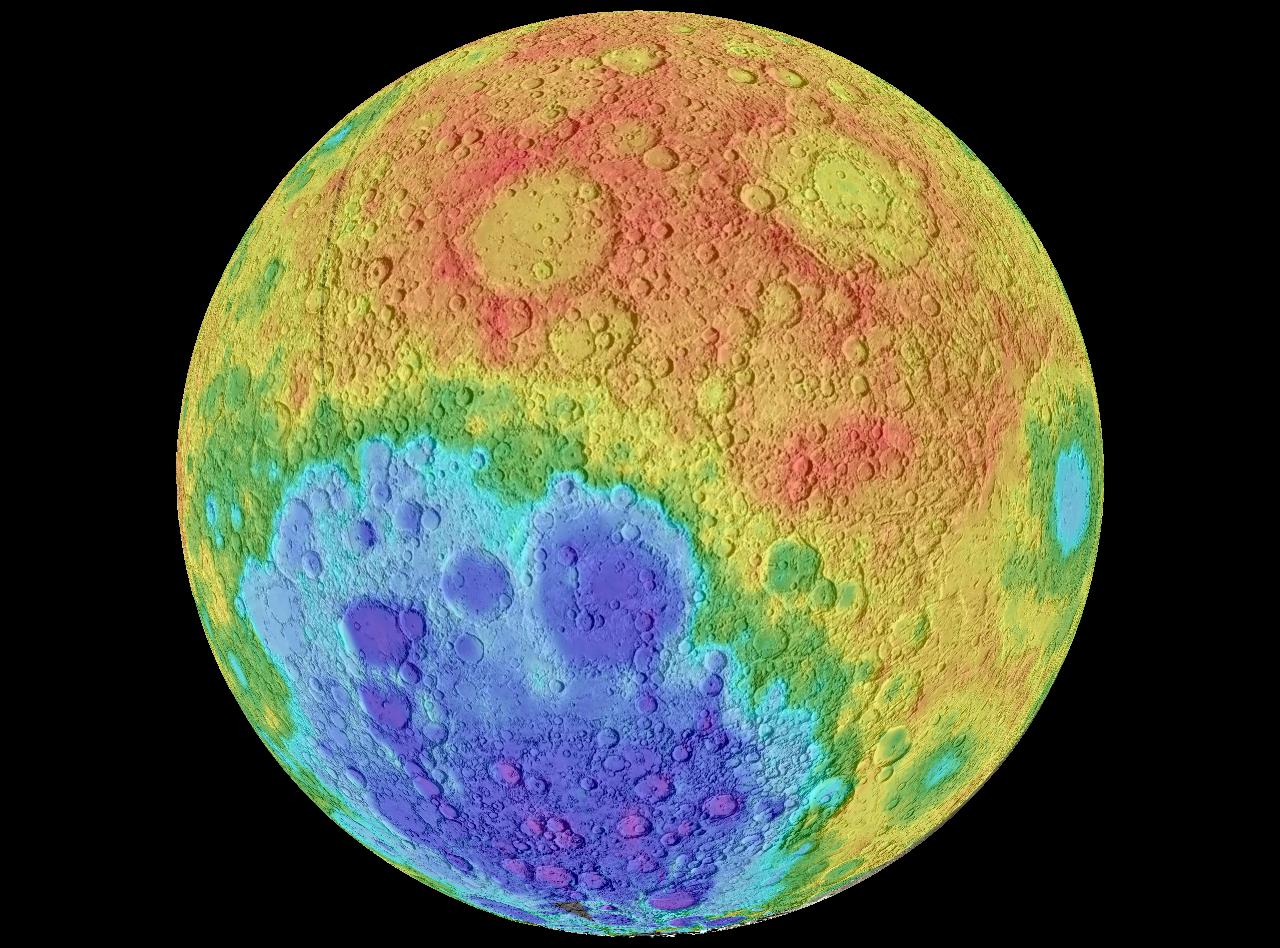
A hypsometric map shows through color tinting, shading and topography, different elevations. This hypsometric map of the moon uses the different colors to show the elevations around the moon. They are useful when showing topographic data around a large area clearly.
http://upload.wikimedia.org/wikipedia/commons/3/3b/Moon_worldwind.jpg

PLSS maps


Public land survey system maps or PLSS maps, are maps that divide the public land that the United States Government owns. This map shows this same type of thing. However over time they change just like other maps and this one is no exception.
http://gis.nwcg.gov/giss_2006/job_aids/maps_and_graphics/USA_PLSS_Meridians_map.jpg

Cadastral maps


Cadastral maps are used to show ownership and boundaries of land. Oftentimes used in land partitioning to resolve disputes. This map of Delaware county divides it into many subdivisions that are owned by different people.
http://www.dalisproject.org/images/cadastral_map.jpg

Thematic Maps


Thematic maps are used to show a theme or trend in a geographic region. This map shows through colors, population growth in the United States. Almost all the states in this map are showing population growth. This one was used to show a census while others can be used for anything from sociological to geographical to political aspects of an area.
http://www.sou.edu/Geography/JONES/GEOG280/stpop96.GIF