Wednesday, February 10, 2010

Statistical maps


Statistiacal maps are used to show a value in proportion to a statistic in a certain region. This map is a map of the distribution of sates that voted for Obama in the 2008 election. The north showed a trend for Obama while the south showed trends toward the republican candidate.
http://www.dailyawesome.com/images/obama_vs_mccain.gif

Cartograms


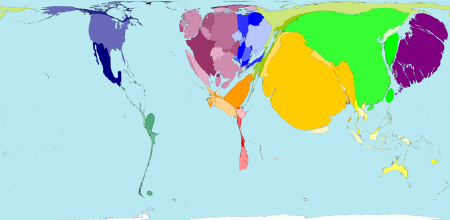
A cartogram is a map that distorts the actual size of a place in order to reflect a number of different things including GDP or world power. This is a cartogram of world populations, the majority of which are found in the east in countries like China and India.
http://www.mcwetboy.net/maproom/images/worldmapper_cartogram.png

Flow Maps


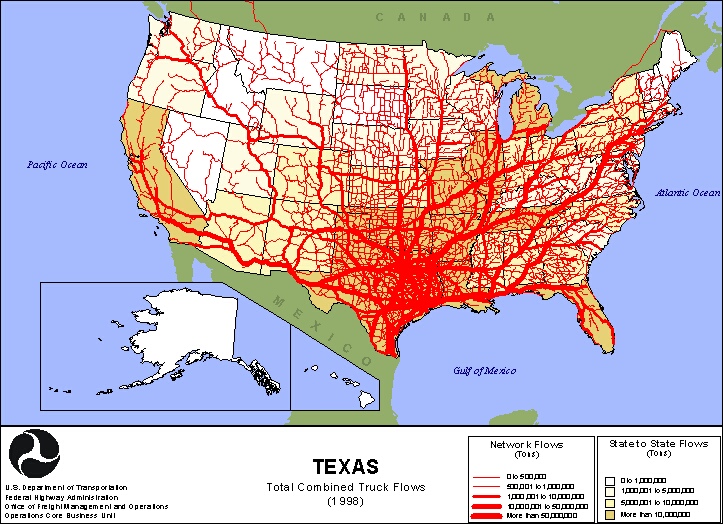
Flow maps are maps used to represent the 'flow' or transportation of objects from one place to another. This map of the U.S maps specific flows of goods via trucks to places all through the country, most are in Texas but several arteries branch out in a fan shape that in turn branch into smaller capillaries exporting to other cities.
http://www.lib.utexas.edu/maps/texas/combtrk_tx_1998.jpg

Isoline maps


Isoline maps are maps that have differing conjoining lines that are used to show many things including altitude, rainfall, depressions etc. This map of china uses them to show waterways and canals that are spread throughout the region.
http://www.unu.edu/unupress/unupbooks/80157e/80157E0T.GIF

Proportional circle maps


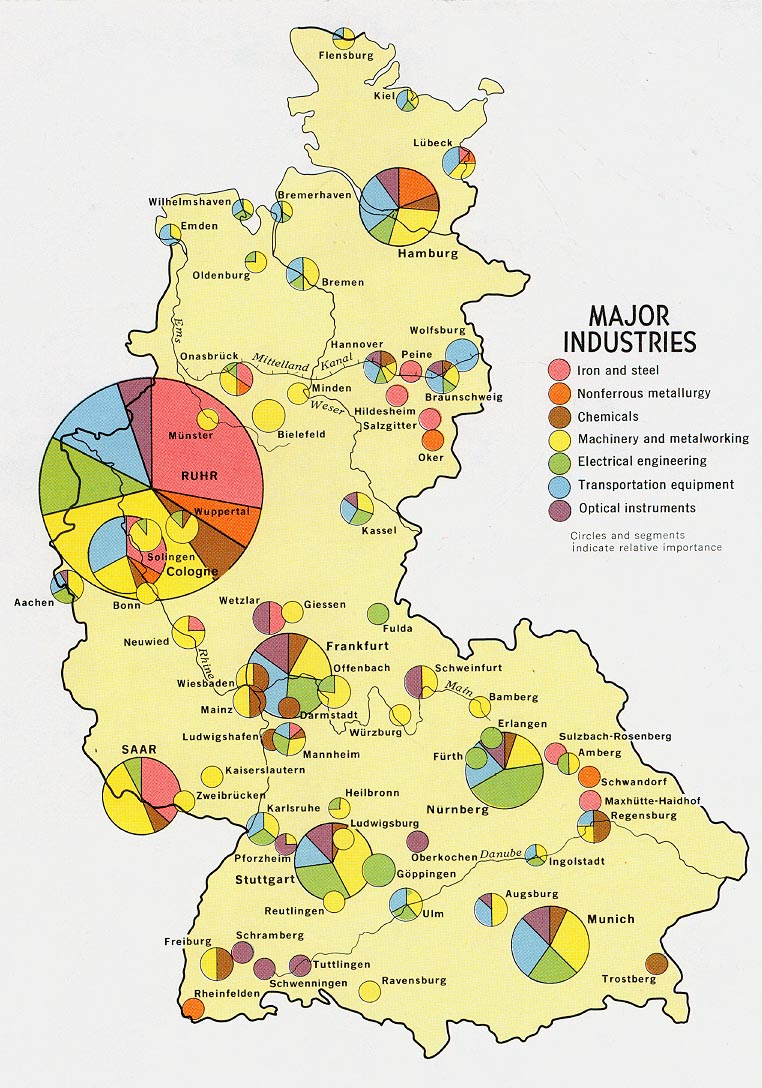
Proportional circle maps show a statistic by using different sizes of circles. In this map, the circles in Germany represent the differing industries and what part of the country they are most prevalent in. Other things can be shown such as populations, unemployment rates, almost anything that has a percentage.
http://www.lib.utexas.edu/maps/europe/west_germany_ind_1972.jpg

Monday, February 1, 2010

Choropleth maps


Choropleth maps are used to show differing proportions among studied digital recordings by different coloring schemes. This map shows voter turnout as it occurred in the 2004 presidential election. The makers used colors to show percentage of voter turnout while small symbols showed at what age was most common to vote in that state.
http://wpcontent.answers.com/wikipedia/commons/thumb/c/ca/2004US_election_map.svg/280px-2004US_election_map.svg.png

Dot distribution maps


Dot distribution maps are helpful in that they can be used to show abundance or size of different populations. Including people, animals, plant or abiotics. This one shows the population of flowering plants as they are distributed about Africa, as you can see most are centralized in southern Africa.
http://www.ville-ge.ch/musinfo/bd/cjb/africa/images/area.gif