Sunday, April 18, 2010

Triangular plot


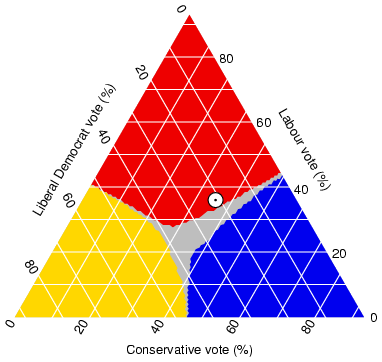
Triangular plots map three different variable inside a triangle through proportions and percentage. They are used in a wide range of topics. This shows voter information such as liberals, labour and conservative voters.
http://www.ex-parrot.com/~chris/images/20050407/triangle.png

Saturday, April 17, 2010

Windrose


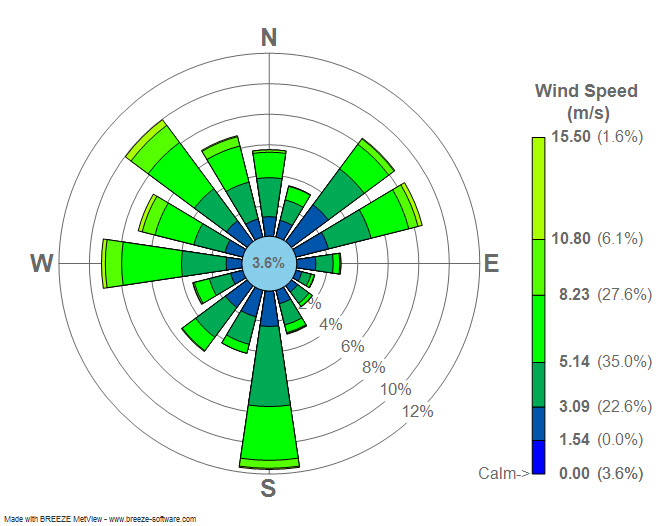
Windrose diagrams are used to show wind speed and direction as a percentage on a circular graph at a location. The wind rose depicted here shows the speed and focus of the wind at a Airport in New York, New York. The most wind being between 3 and 8 mph and facing south.
http://upload.wikimedia.org/wikipedia/commons/7/70/Wind_rose_plot.jpg

Climograph


Climographs show monthly or annual precipitation and temperature conditions in a certain region. This one is from Australia and it shows that while rainfall remains the same pretty much throughout the year, because the continent lies south of the equator, the winter is in July.
http://www.uwsp.edu/gEo/faculty/lemke/geog101/images/09_climograph_BSh.gif

Population profile


Population profiles are used in showing population dynamics within a nation. THey show what percent of the population is in what age range. Oftentimes additional data may be added to the plot showing further trends. For example, this one shows population in Africa and the percent of the population with HIV/AIDS and what age bracket they lie in.
http://www.ifad.org/operations/regional/pf/figure1.gif

Scatterplot


Scatter plots are plotted data from a range of variables usually comparing two different things. They are often used to show correlation among different contingencies. This one shows the relation between husband age and wife age. It is positively correlated almost perfect linear relationship.
http://www.mzandee.net/~zandee/statistiek/stat-online/chapter4/graphics/age_scatterplot.gif

Index value plot


Index value plot are basically graphs. Data from a range of variable located on a positive grid showing a numerical value. This Plot shows stocks an India over time adjusted for inflation. Over a period of fourty-five years it has nearly grown by five hundred percent.
http://www.iimahd.ernet.in/~jrvarma/blog/Y2009/real-stock-index-1965-2008.png

Monday, April 12, 2010

Lorenz curve


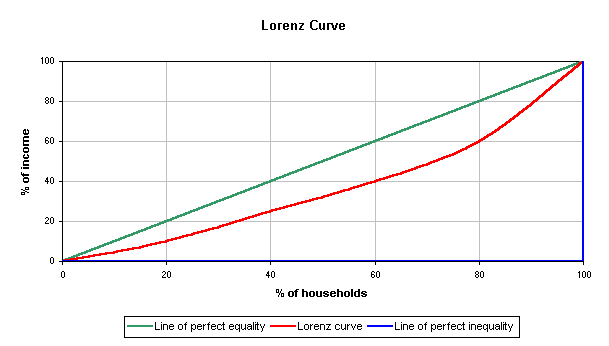
Lorenz curve is usually used in economics and shows the average distribution of wealth within a society. The curve usually falls between a line of perfect equality and a line of perfect inequality.
http://upload.wikimedia.org/wikipedia/commons/b/bd/Lorenz-curve1.png